
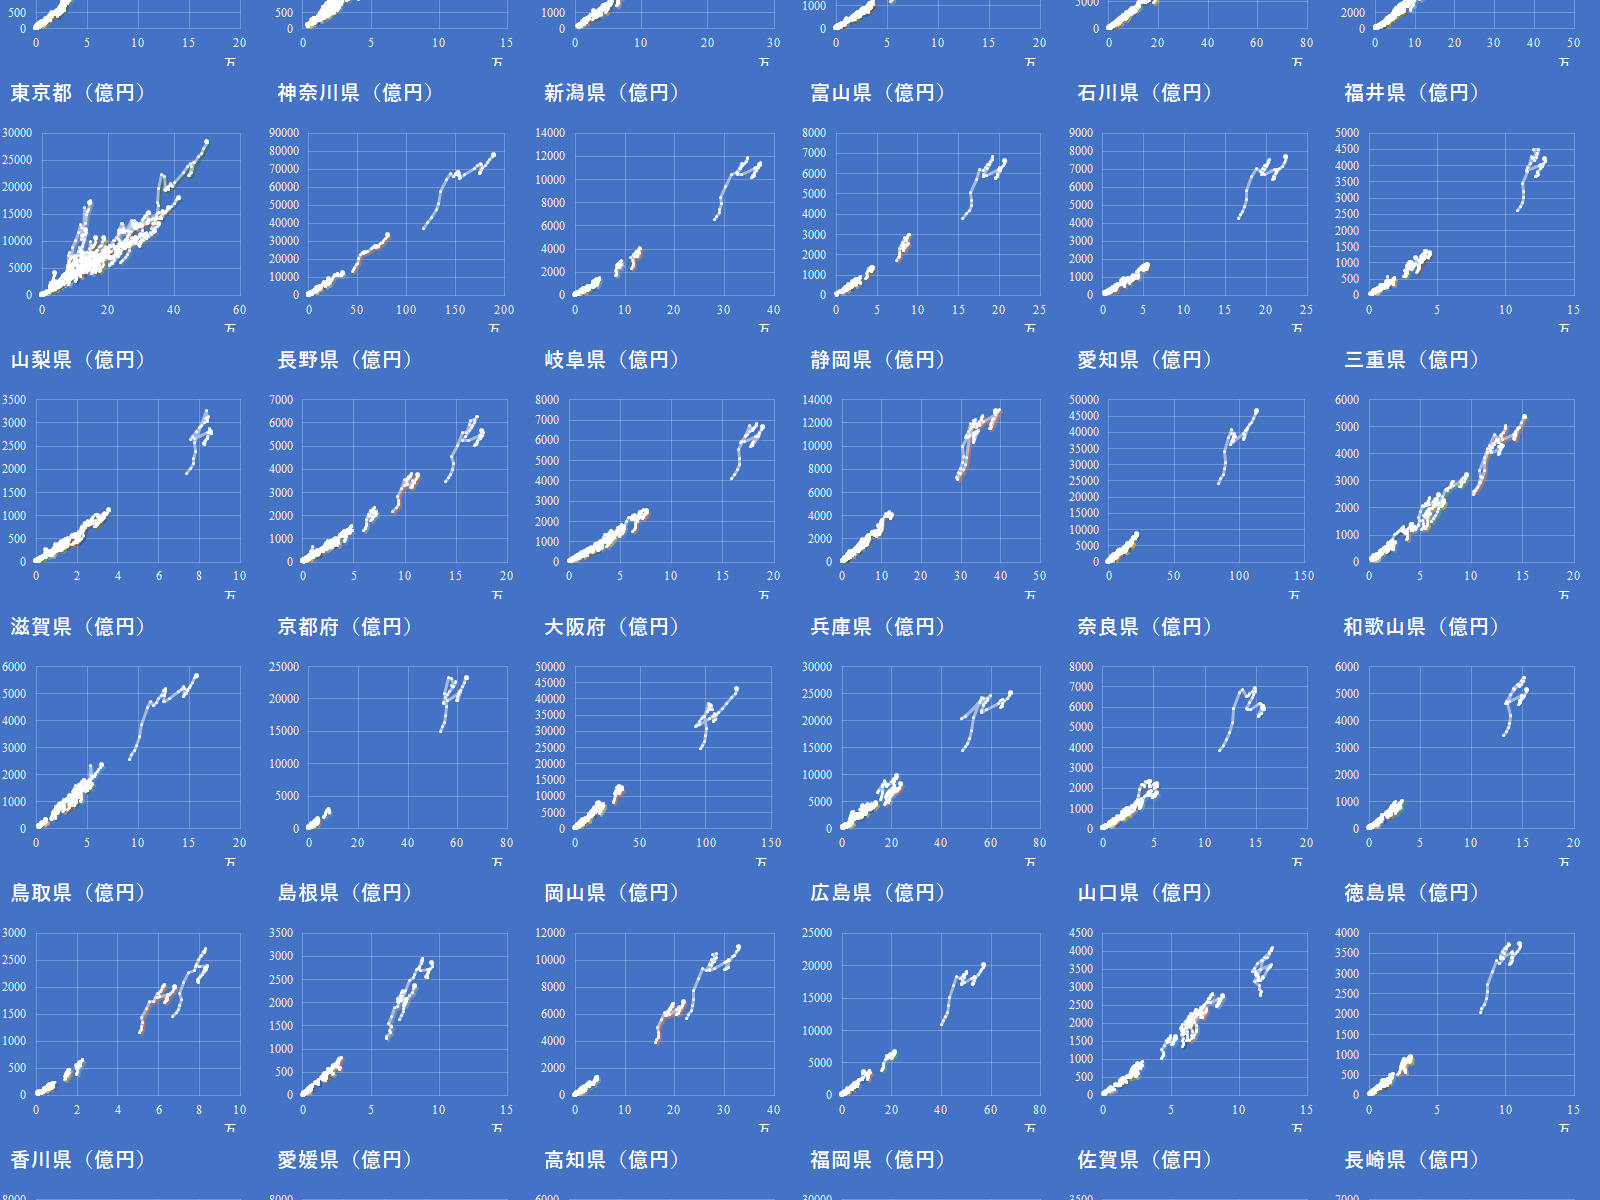
eStatには納税義務者数(所得割)と課税対象所得のデータが1985年から2020年まである.今回は都道府県別の自治体ごとの納税義務者数と課税対象所得の散布図を示す.
データのダウンロード
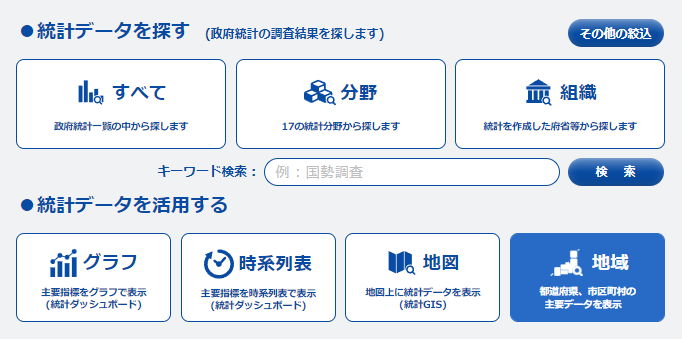
eStatトップページの「地域」をクリックする.
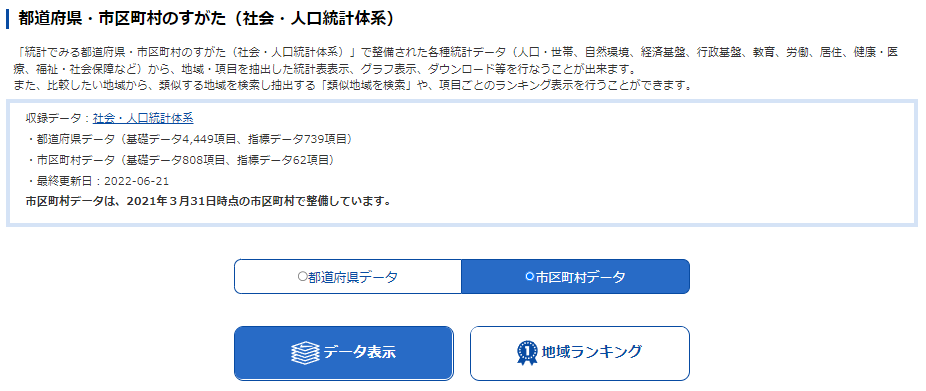
「市区町村データ」「データ表示」をクリックする.
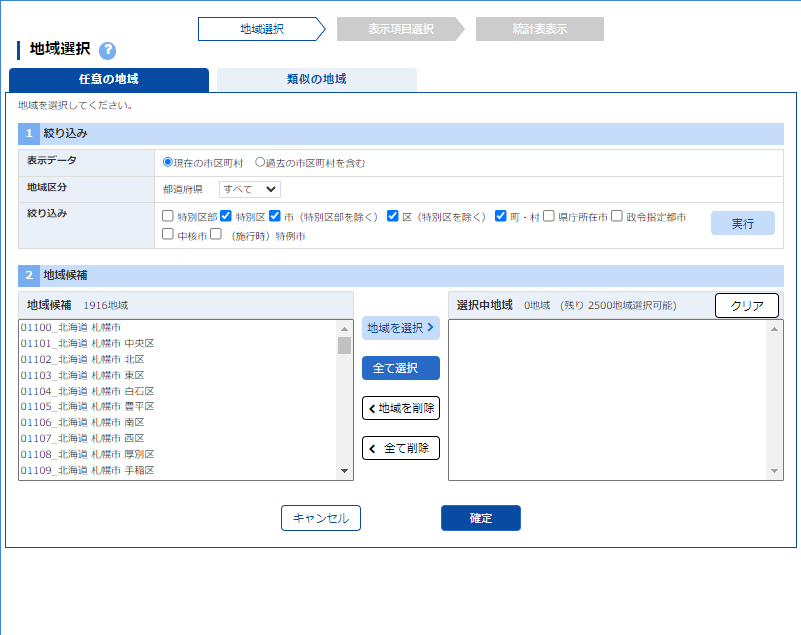
「地域選択」で「全て選択」をクリックする.
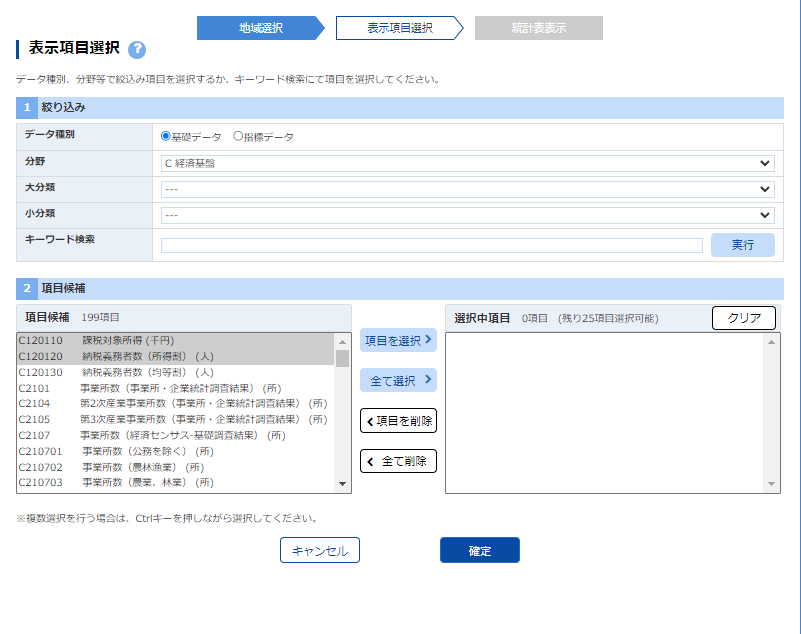
「表示項目選択」で分野を「C.経済基盤」とし,「課税対象所得(千円)」「納税義務者数(所得割)(人)」を選択する.
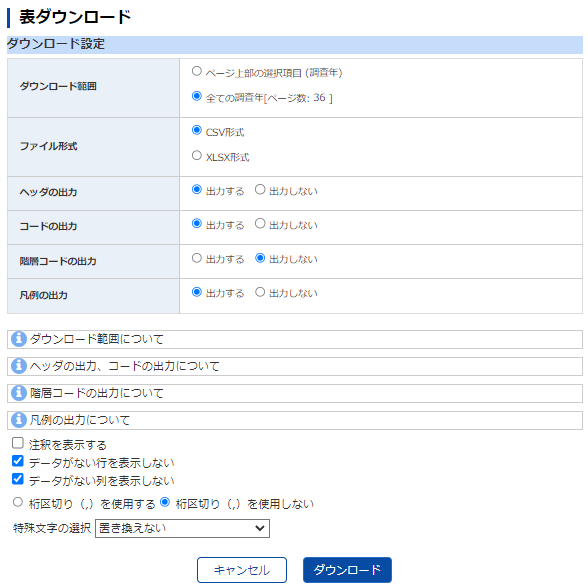
右上の「ダウンロード」をクリックする.
「表ダウンロード」で「注釈を表示する」「桁区切りを使用しない」に注意する.
Power Queryによるデータクレンジング
Excelのパワークエリで読み込む前にメモ帳で対象ファイルを開き,***, X, -の文字列を削除しておく.また不要なヘッダー行が数行あるのでこれも削除しておく.
詳細は割愛するが,Power Queryでは不要な列の削除,年度の列を数字のみに列分けする,地域名を都道府県と市区町村に分ける,地域コードから都道府県コードを抽出するなどの処理を行う.データのない行の削除も行っておく.
EXCEL VBAによるグラフ作成
一段目のループ内で47都道府県のグラフを作成している.市区町村マスターを都道府県コードでフィルターし,残った市区町村コードを走査して地域コードを取得し,取得した地域コードでトランザクションテーブルをフィルターする.残った行が一つの市区町村の経時的データである.
後半は主にデータ系列のお化粧である.ChartTitleオブジェクト,Axisオブジェクト,PlotAreaオブジェクト,ChartAreaオブジェクト,Pointオブジェクトを操作している.Pointsコレクションのうち最後のPointオブジェクトのMarkerSizeを変えている.この文脈では最新のデータポイントに当たる.
コード
Option Explicit

Sub NewCharts()

Dim mySh1   As Worksheet
Dim mySh2   As Worksheet
Dim mySh3   As Worksheet

Set mySh1 = Worksheets("市区町村マスター")
Set mySh2 = Worksheets("納税義務者数,課税対象所得")
Set mySh3 = Worksheets.Add

Dim i       As Long
Dim myCht   As Chart
Dim myLstObj1   As ListObject
Dim myLstObj2   As ListObject

Set myLstObj1 = mySh1.ListObjects(mySh1.ListObjects.Count)
Set myLstObj2 = mySh2.ListObjects(mySh2.ListObjects.Count)

Dim myRng1  As Range
Dim myRng2  As Range
Dim myRng3  As Range

Dim j       As Long
Dim myCity  As String
Dim myXValue()  As Long
Dim myValue()   As LongLong

Dim mySeries    As Series
Dim myPref      As String
Dim myAxis      As Axis
Dim myPoint     As Point

With mySh3
For i = 1 To 47
    Set myCht = .Shapes.AddChart2(Style:=247, _
                                XlChartType:=xlXYScatterLines, _
                                       Left:=200 * ((i - 1) Mod 6), _
                                        Top:=200 * ((i - 1) \ 6), _
                                      Width:=200, _
                                     Height:=200).Chart
    With myLstObj1
        .Range.AutoFilter field:=2, Criteria1:=i


        Set myRng1 = Intersect(.DataBodyRange, _
                                .Range.SpecialCells(xlCellTypeVisible), _
                                .ListColumns("地域コード").Range)
        myPref = myRng1.Cells(1, 3).Value
        For Each myRng2 In myRng1
            With myLstObj2
                .Range.AutoFilter field:=2, Criteria1:=myRng2.Value
                Set myRng3 = Intersect(.Range.SpecialCells(xlCellTypeVisible), _
                                    .DataBodyRange)
                If myRng3 Is Nothing Then
                Else
                    For j = 0 To myRng3.Rows.Count - 1
                        ReDim Preserve myXValue(j)
                        ReDim Preserve myValue(j)
                        myCity = myRng3.Cells(j + 1, 5)
                        myXValue(j) = myRng3.Cells(j + 1, 6)
                        myValue(j) = myRng3.Cells(j + 1, 8)
                    Next j
                    Set mySeries = myCht.SeriesCollection.NewSeries
                    With mySeries
                        .Name = myCity
                        .XValues = myXValue
                        .Values = myValue
                    End With
                End If
                .Range.AutoFilter field:=2
            End With
        Next myRng2
        .Range.AutoFilter field:=2
    End With
    With myCht
        .HasTitle = True
        With .ChartTitle
            .Caption = myPref + "(億円)"
            .Left = 0
        End With
        Set myAxis = .Axes(xlCategory)
        With myAxis
            .DisplayUnit = xlTenThousands
        End With
        Set myAxis = .Axes(xlValue)
        With myAxis
            .DisplayUnit = xlHundredMillions
        End With
        With .PlotArea
            .Left = -10
            .Width = 200
        End With
        With .ChartArea
            .Format.TextFrame2.TextRange.Font.Name = "TimesNewRoman"
        End With
        For Each mySeries In .SeriesCollection
            With mySeries
            For Each myPoint In .Points
                With myPoint
                    .MarkerStyle = xlMarkerStyleCircle
                    .MarkerSize = 2
                    .MarkerBackgroundColor = RGB(255, 255, 255)
                    .MarkerForegroundColorIndex = xlColorIndexNone
                End With
            Next myPoint
            .Points(.Points.Count).MarkerSize = 4
            End With
        Next mySeries
    End With
Next i

End With
End Sub
結果

まとめ
都道府県別の各市区町村の納税義務者数と課税対象所得の推移を散布図に示した.注意すべきは課税対象所得の大きい市区町村に住んでいるからと言って,全員の所得も大きいとは必ずしも限らないことである.例えば東京都は納税義務者数あたりの課税対象所得が最大であるが,東京に住んでいるからと言って必ずしも全員の所得が大きい訳ではない.高額納税者は一部に偏っていることに注意すべきである.
納税義務者数を均等割にしてみると,さほど差は開かないことにも注意が必要である.